Report
The Report module provides analytical views of batch processing activity. Supervisors and managers use it to measure throughput, identify bottlenecks, track user performance, and support audit or compliance requirements.
Available Reports
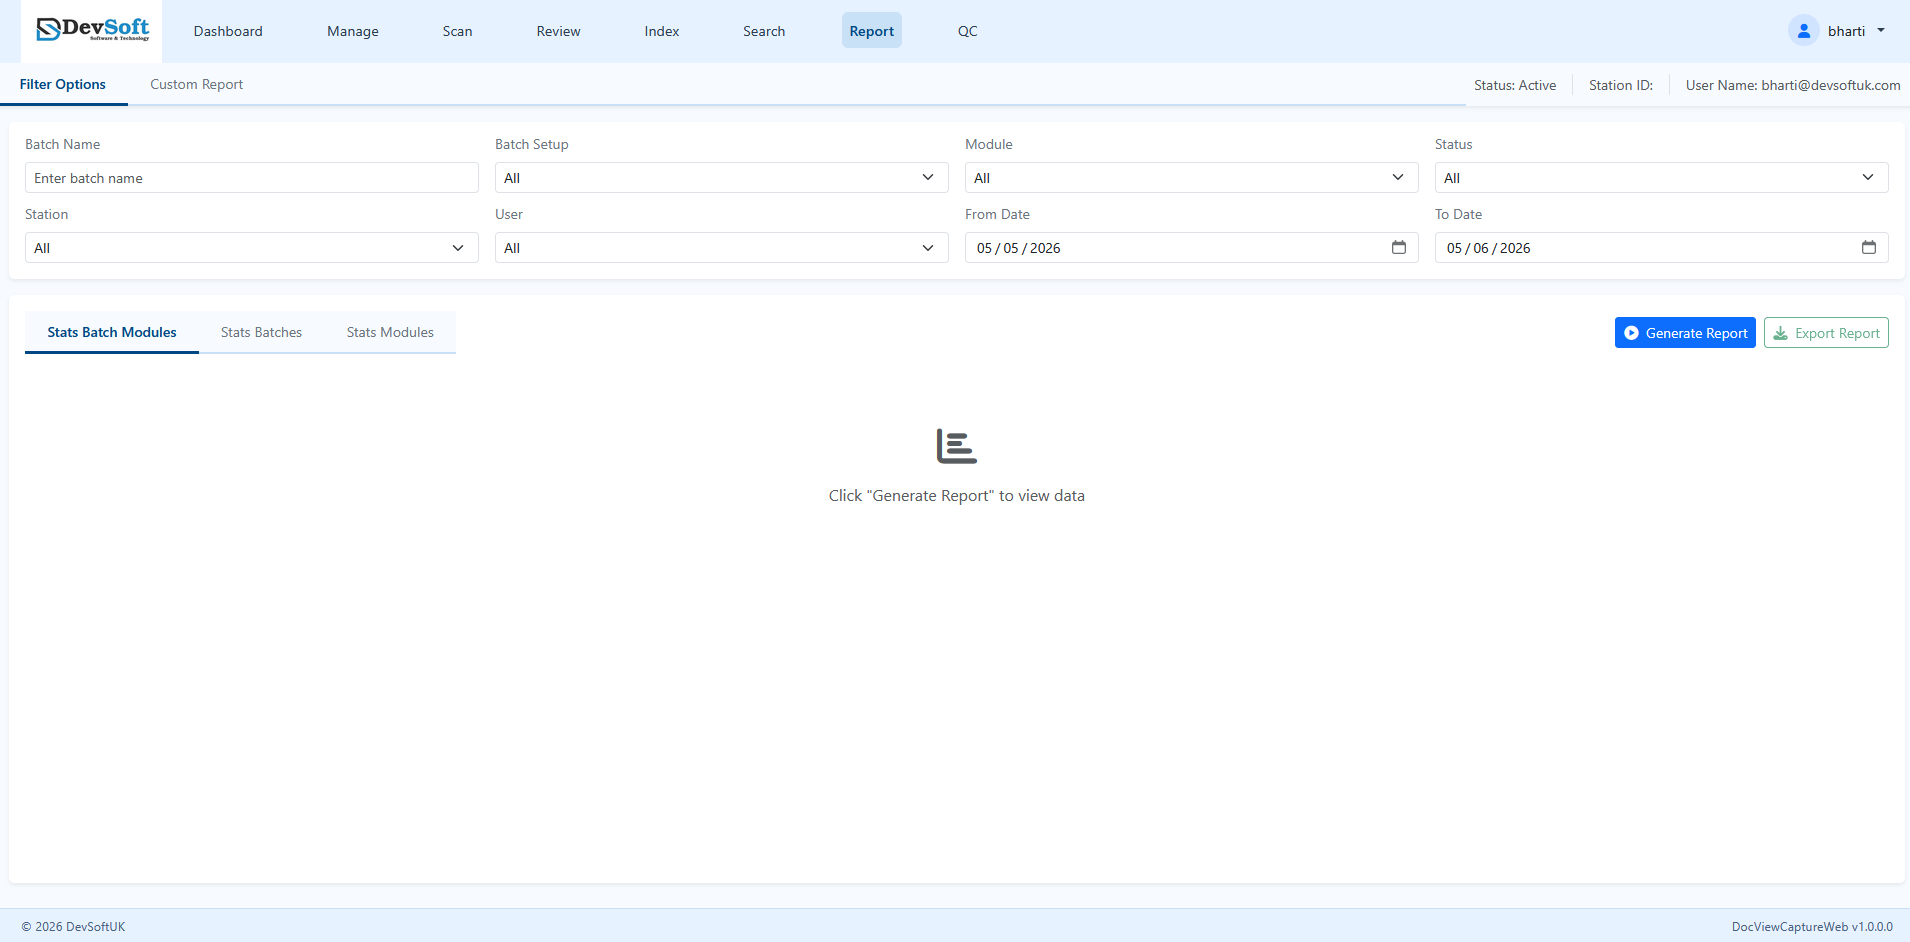
The reporting interface is split into two main sections: Filter Options and Custom Report.
Filter Options Tab
Includes three pre-configured operational statistics reports:
- Stats Batch Modules – Analyse average processing times and volume of batches passing through each module.
- Stats Batches – Track which batches were created, processed, and completed within a given date range.
- Stats Modules – Measure the total batch, document, and sheet volumes processed per queue module.
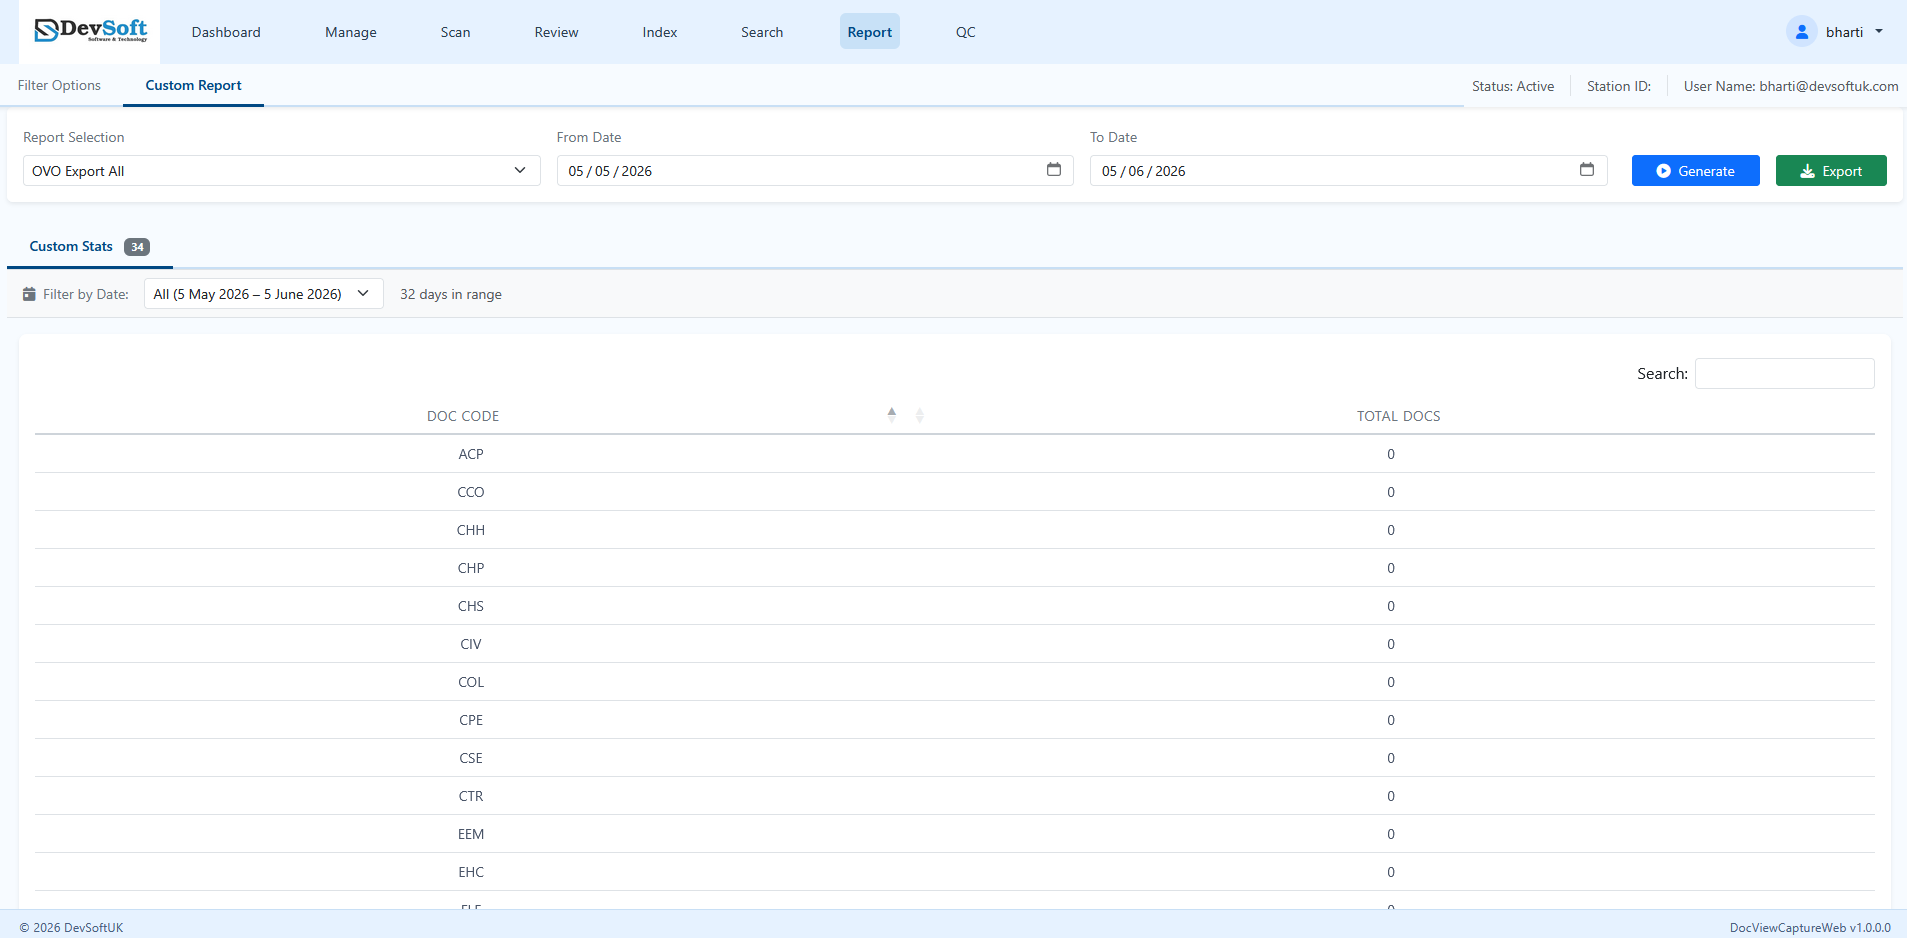
Custom Report Tab
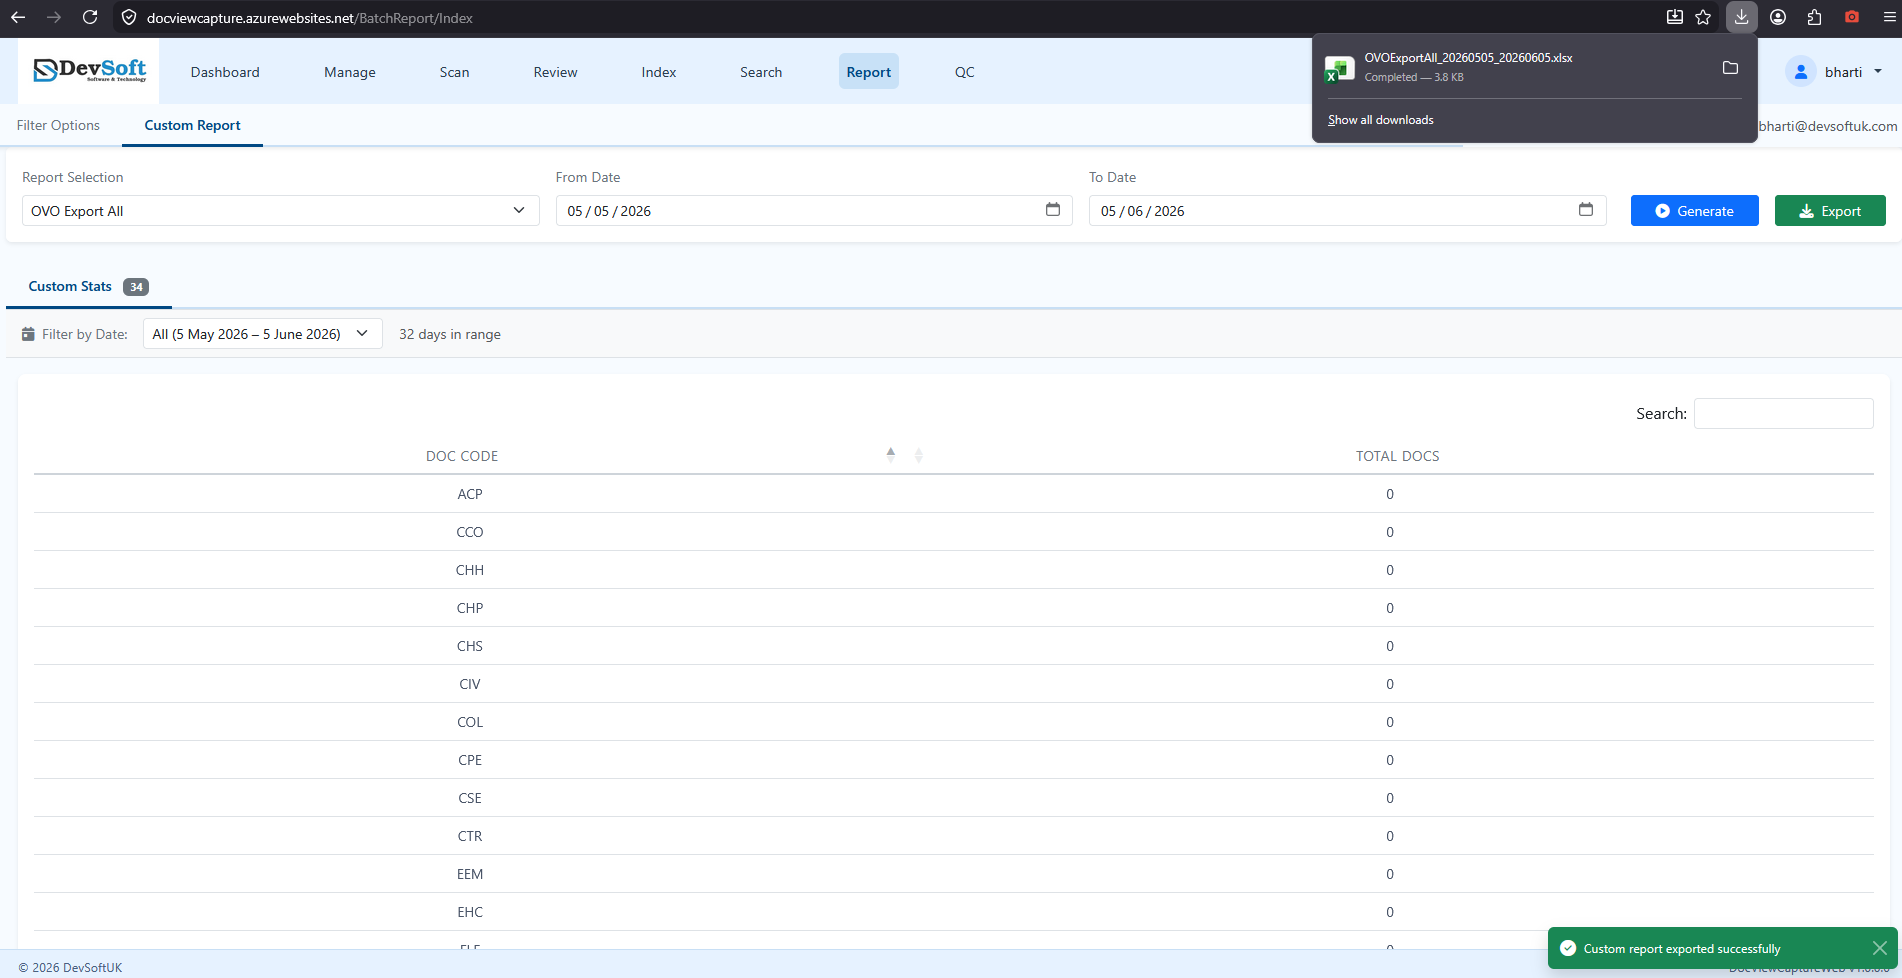
- Report Selection – Choose a customized report definition from the dropdown list.
- Custom Dates – Define a custom date range, then click Generate to retrieve tailored data metrics based on administrative setups.
Filtering and Generating Reports
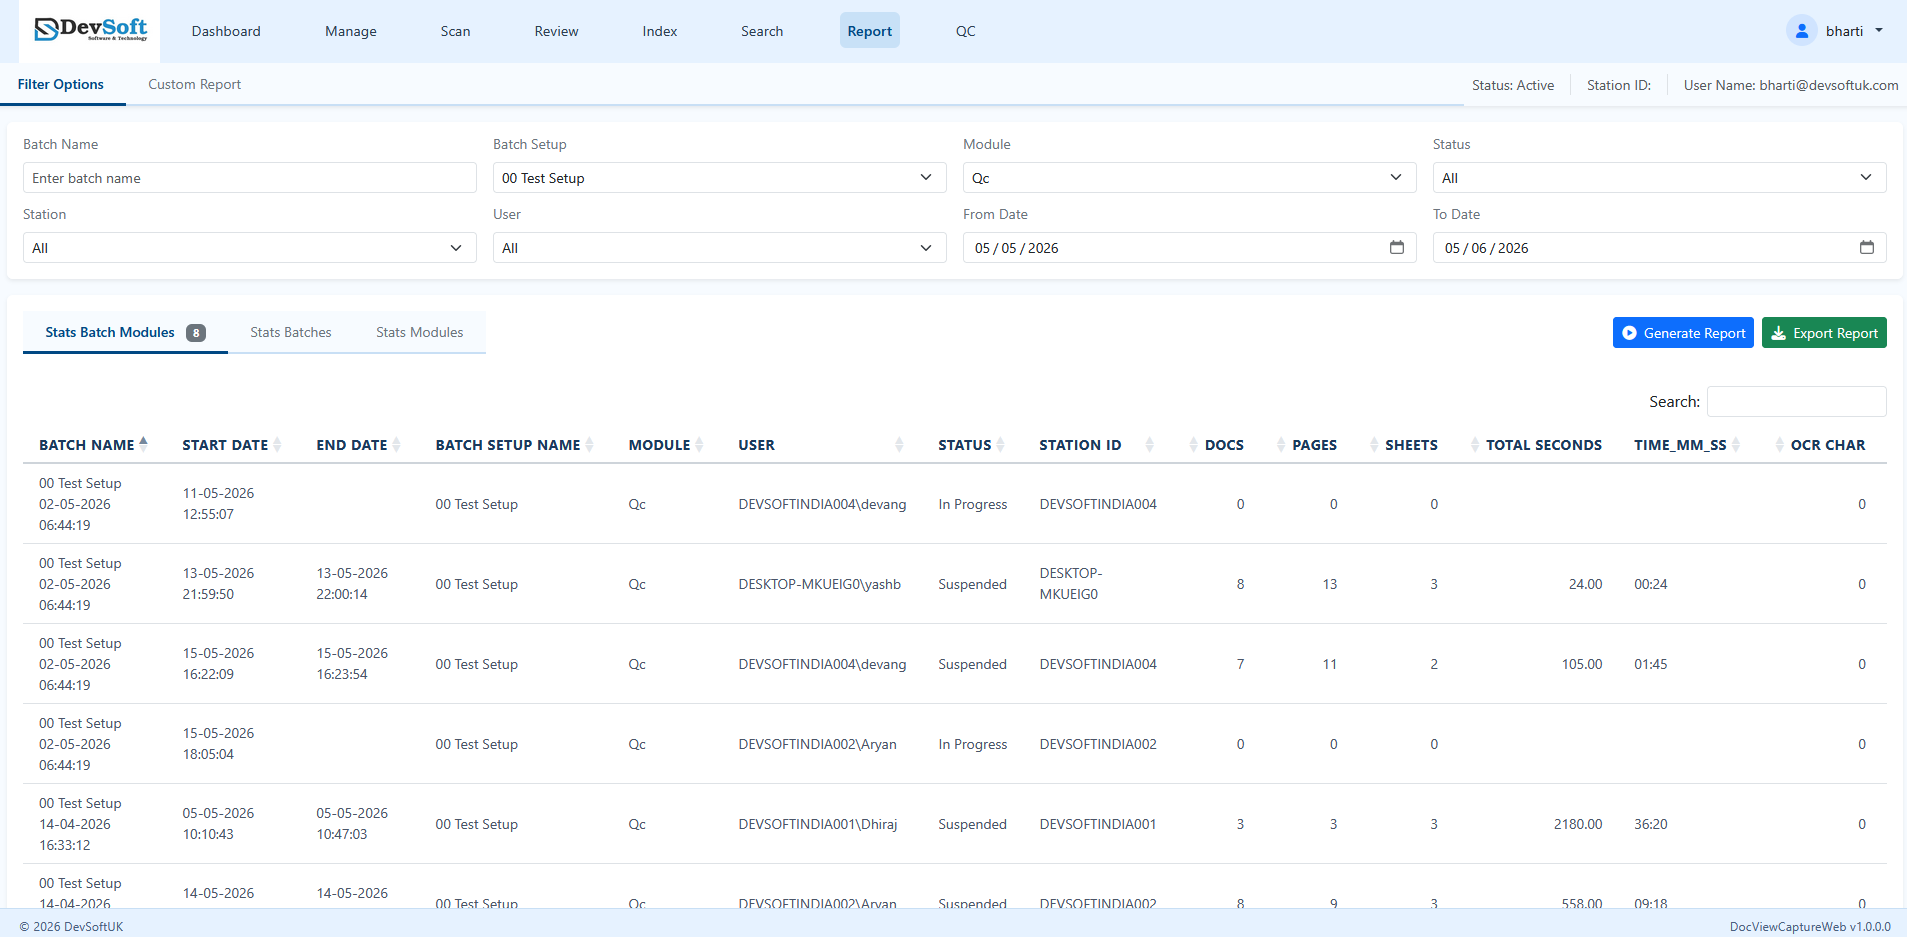
To generate a report under the Filter Options tab:
- (Optional) Filter by Batch Name, Batch Setup, Module, Status, Station, or User.
- Select the From Date and To Date range. (By default, the system automatically sets the date range from one month ago to today's date).
- Select the desired report tab: Stats Batch Modules, Stats Batches, or Stats Modules.
- Click Generate Report to run the query.
Interactive DataTable & Exporting
Reports are displayed in an interactive, responsive grid with advanced navigation features:
- DataTable Controls – Sort columns, perform column-specific searches, page through data, and choose row counts (10 to 100 per page).
- Export Report – Click the Export Report button to compile the current report view into a Excel file (
.xlsx) or download it for offline management analysis.